Aug 12 IMPORTANT UPDATE: An epidemiologist contacted me to ask a question, which revealed a critical error I had made. I have scrutinized so much of this (the code, the math, the definitions used by the OSDH), but I had neglected to notice that the source data table I used for population used metropolitan population instead of city population. Once that is included, the gap between mandate and non-mandate cities closes. This has the biggest change on how we look at OKC and an even bigger impact on Tulsa. But as a whole, mandate cities are still faring better than non-mandate cities, and the gap has widened since the mandates started. I am also reassured that a professional has verified that in their independent analysis they are seeing the same general trend, which should provide more confidence that this is not suffering from other major errors. My apologies for this mistake.
Another change: I am excluding the cases the state reports as Other. Longer explanation below under change log.
Comparisons of All Cities With And Without Mandates
These plots show the trends in Cases, Deaths, and Active Cases per capita since May, separating the 13 cities that passed mandates in July from those that did not. Arrows indicate then various mask mandates were passed, and it is during this period when you begin to see an increased divergence.
Aug 13: Using the correct population figures, if the non-mandate cities included in the state reporting had the same per capita trends in cases as the mandate cities since July 11, there would be 1771 fewer cases. Based on a case fatality rate in Oklahoma since June 1 of .76, this would be associated with 13.5 deaths.
Based on our experience with the shutdowns and reopening, we should expect to wait 4+ weeks to know definitively how changes in policy impact cases and another 4+ weeks to see how they impact mortality.
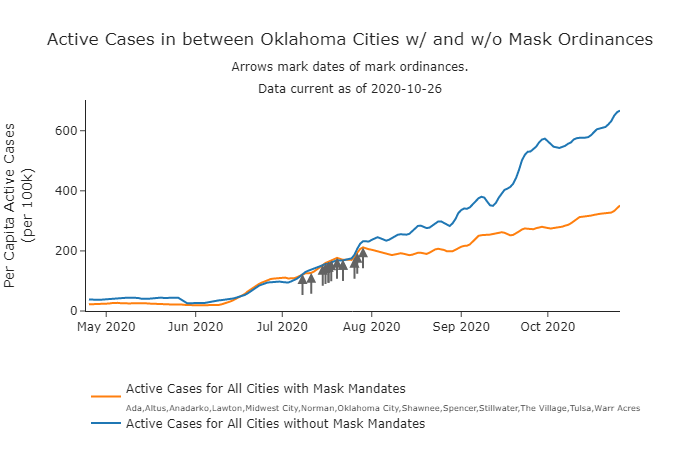
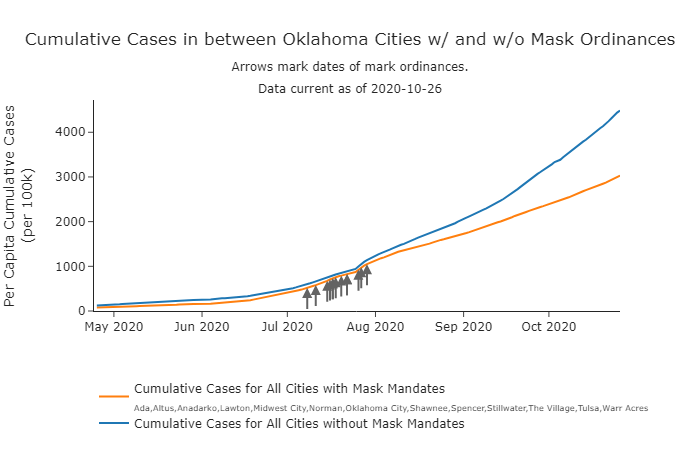
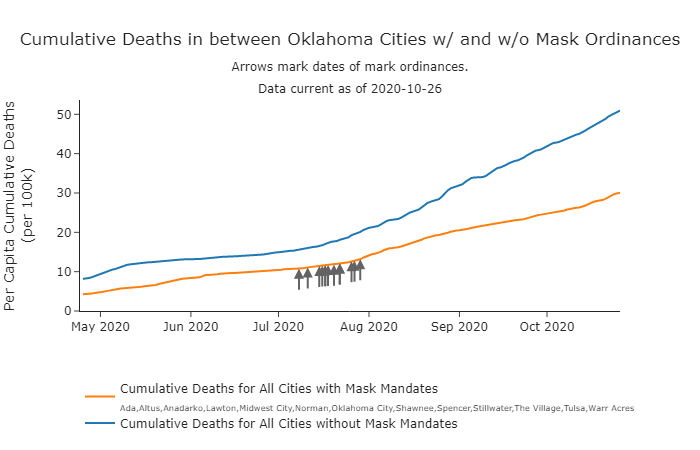
Overview of the Impact of Masks
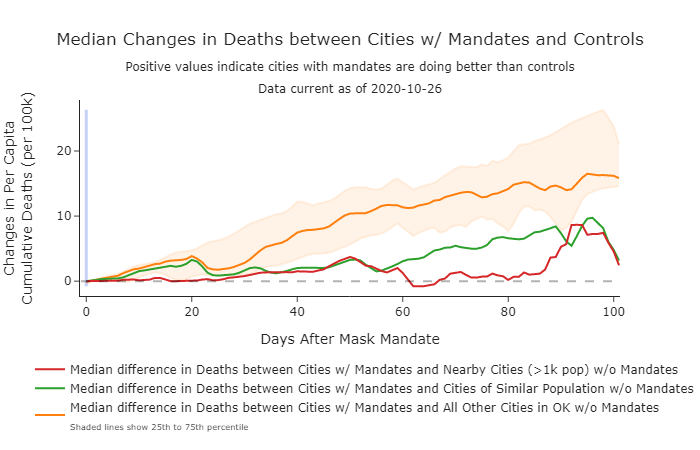
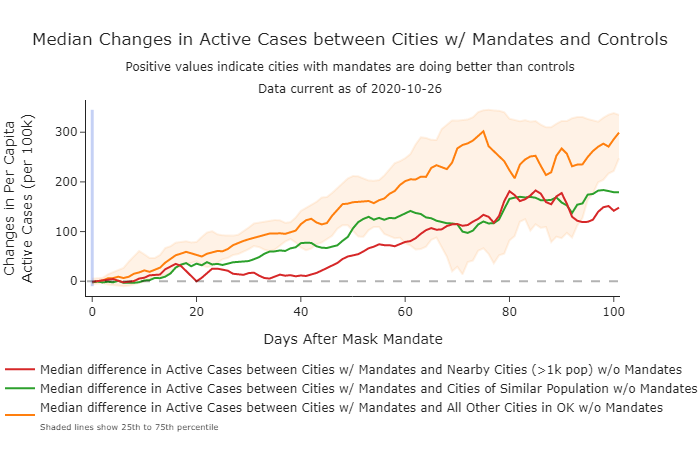
The problem with the plot above is that there were three weeks between passing the first mandate and the last. The plots aggregate the median changes between mandate and non-mandate cities based on the days since the mandates were passed.
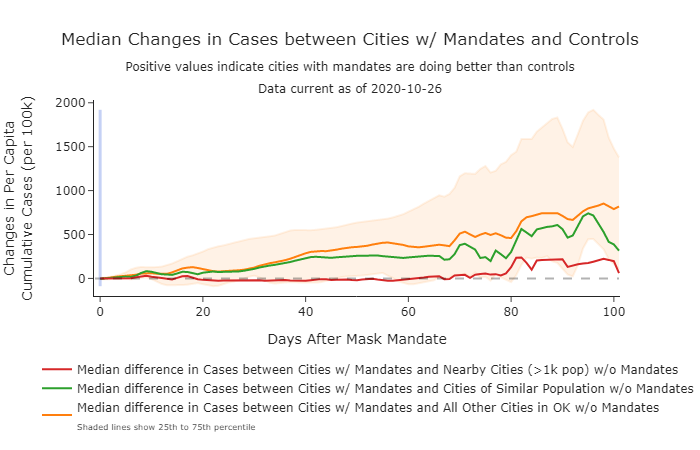
Here is how to read the graph above. The vertical blue line shows the day the mandate went into effect, and to the right are the number of days after the mandate. The differences in cumulative case numbers are show relative to the numbers on the day the mandate was passed to allow us to compare cities. The different color lines show how mandate cities changed compared to three different choices of comparisons. When these lines are above zero, that means the cities with the mask mandates are doing better than the controls, and negative values indicate they are doing worse.
The Experiences of Individual Cities – Cases
I am going to classify cities into categories based on their case patterns: Masks Work, Mixed Results, Outbreak with Mandate, and Hard to Know.
| Pattern | Cities | Count |
| Masks Work | Ada Lawton Midwest City Shawnee Stillwater The Village | 6 (61%) |
| Mixed Results | Norman Oklahoma City | 2 (16%) |
| Outbreak With Mandate | Altus Andarko Warr Acres | 3 (23%) |
| Doing Worse | Tulsa | 1 (8%) |
| Hard to Know | Spencer | 1 (8%) |
How to Read These Graphs
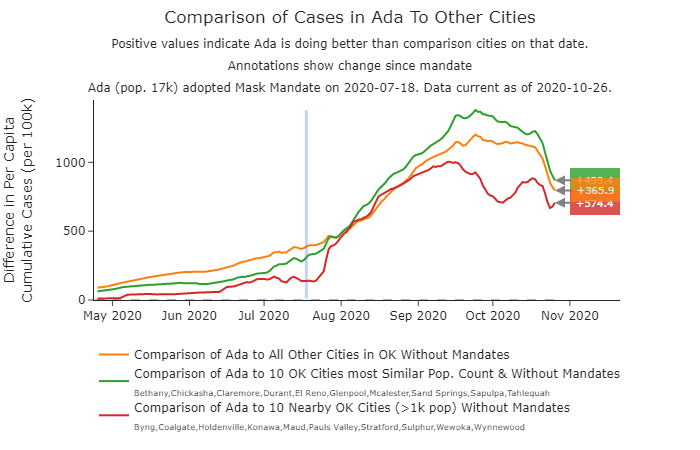
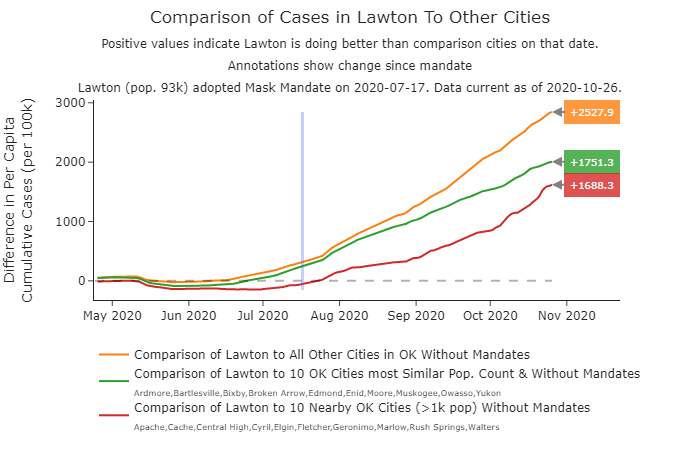
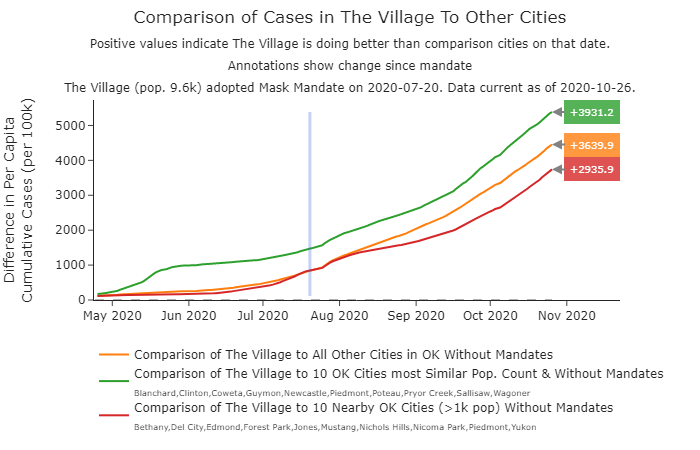
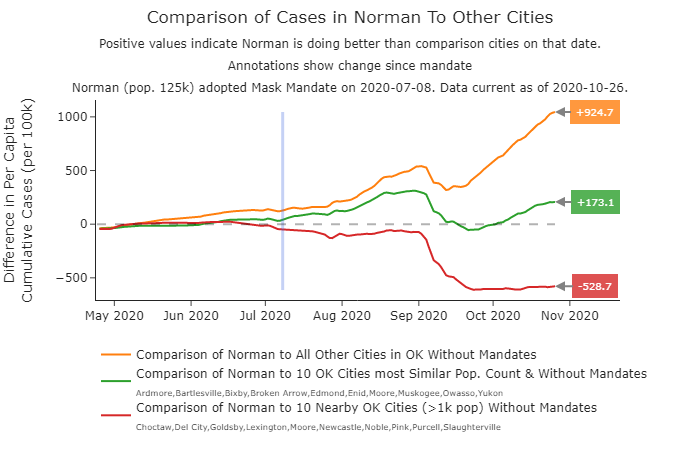
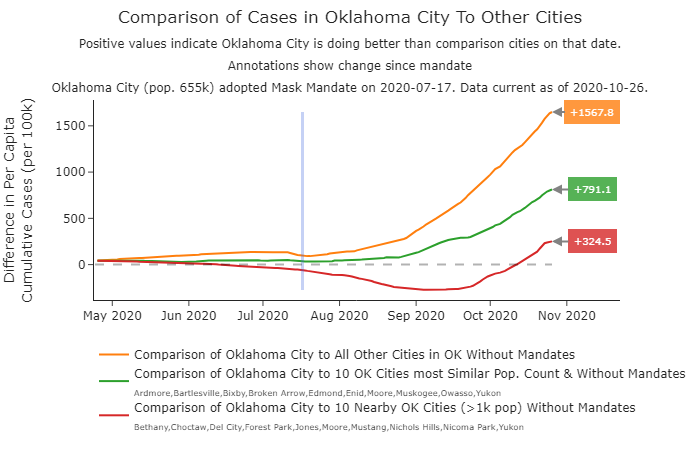
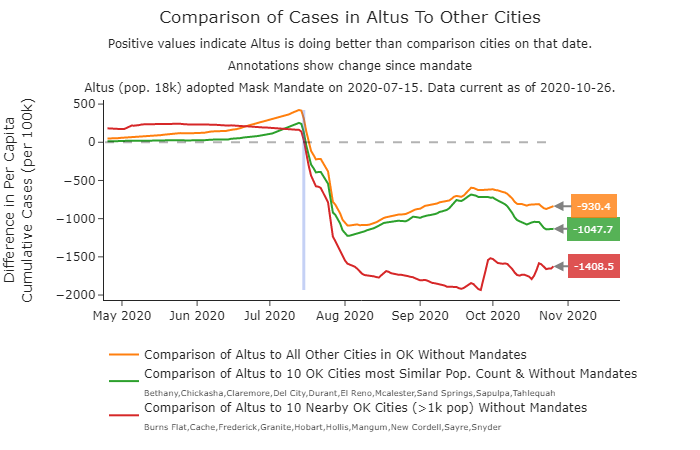
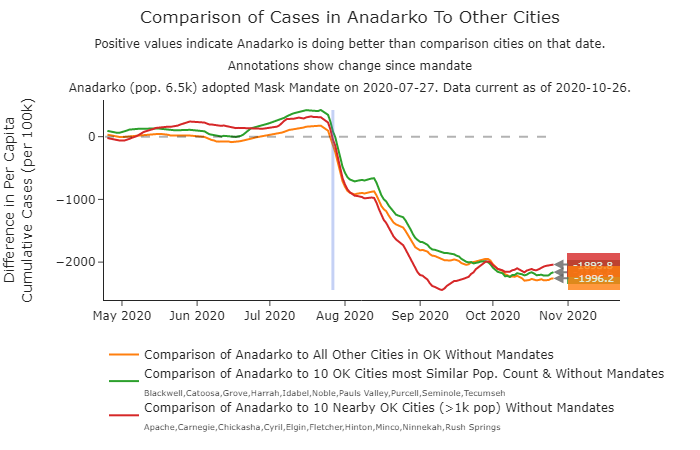
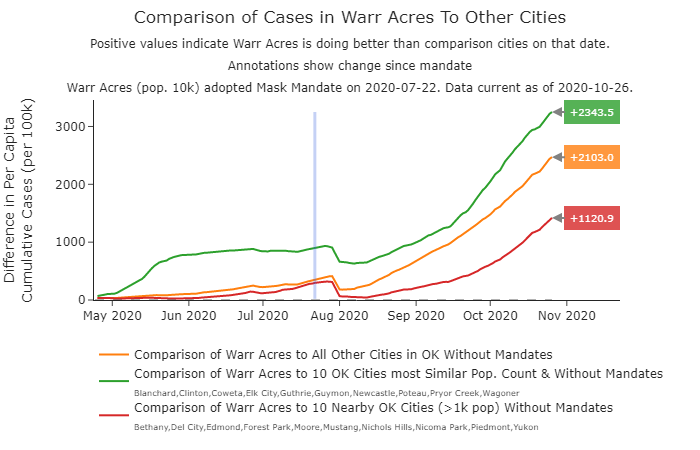
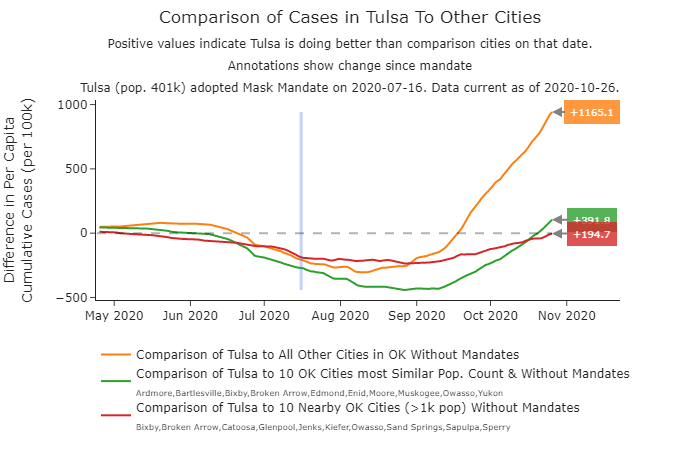
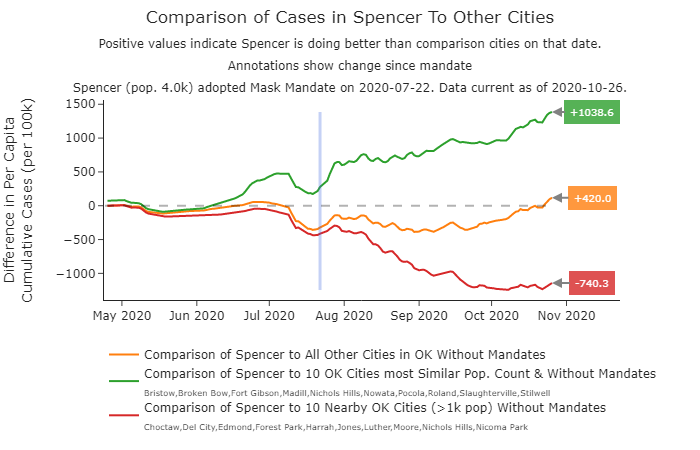
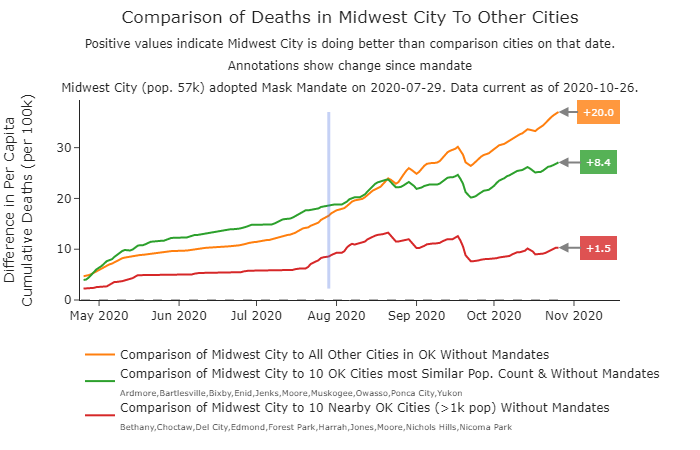
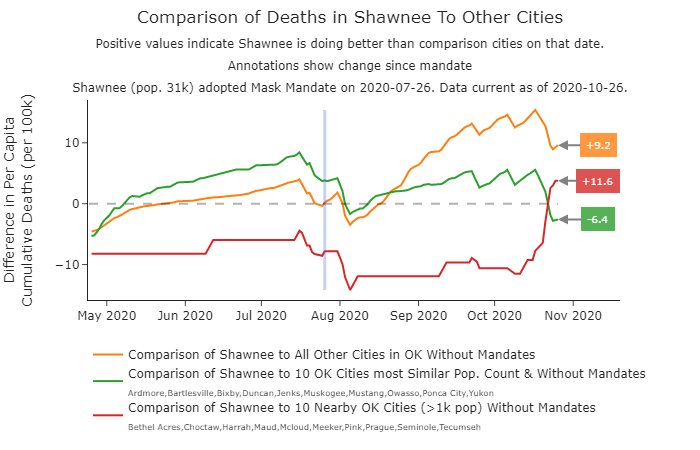
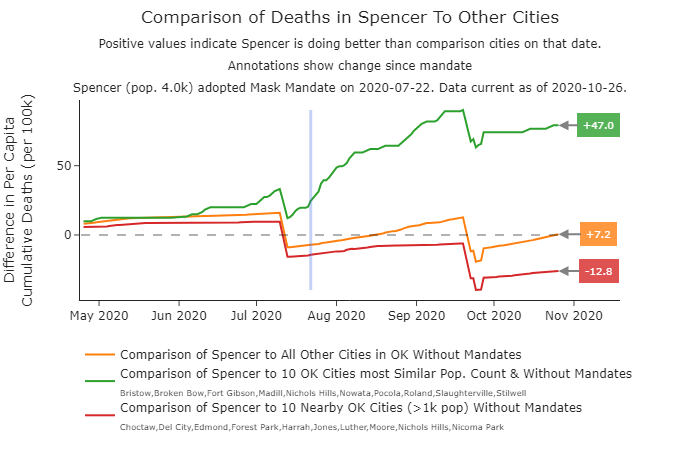
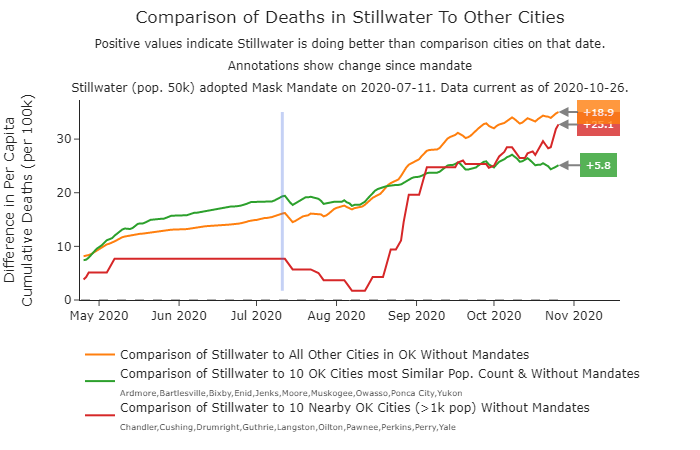
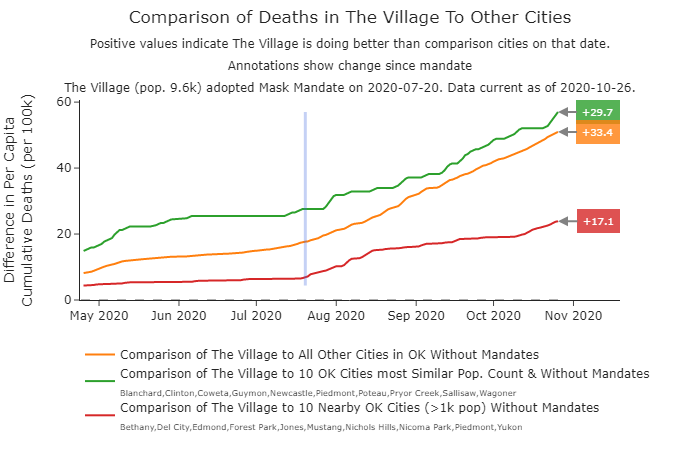
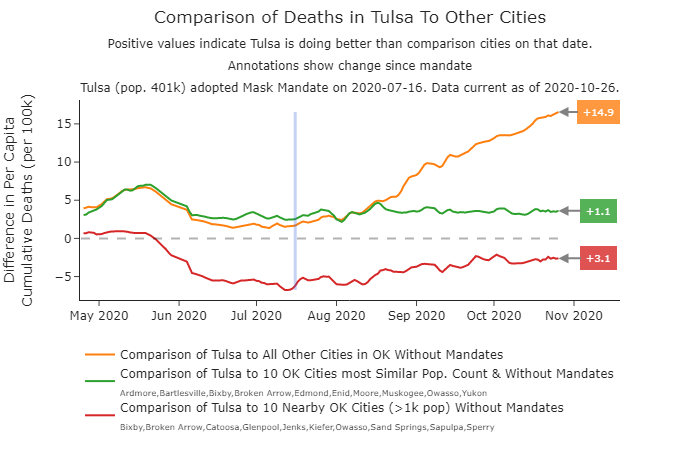
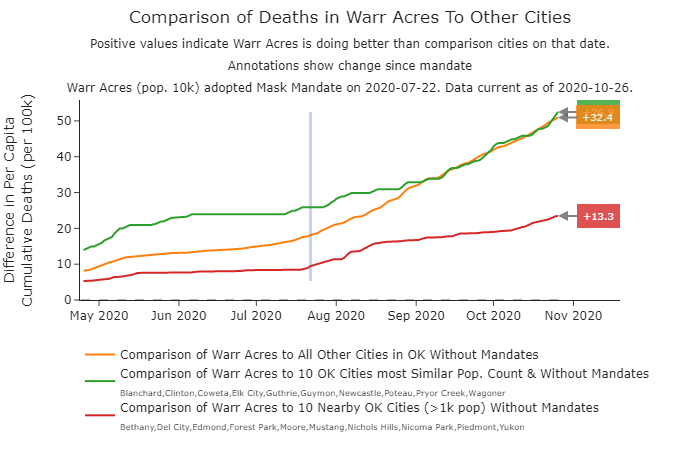
These plots vary in one key aspect from the median change graphs above. Above, the plots show the change in cases and deaths once the mandate is passed. These show the difference over the entire record. Values below zero indicate that city has more cases than the comparison. The annotations on the right quantify the amount of change since the mandate went into effect.
For example, in the plot of Lawton, it says that on July 1 Lawton had fewer per capita cases than all non-mandate cities (orange line) and non-mandate cities with similar populations (green line). But it had about 150 more per capita cases than nearby non-mandate cities.
Masks work
In Ada, Lawton, Midwest City,Shawnee, Stillwater, and The Village the cities are doing better than all comparable groups of cities since they passed their mask mandate. Most were also improving in the days or weeks before the mandate when into effect. My leading guess is that these communities had higher proportions of residents interested in wearing masks as the pandemic numbers increased in July.
Unlike the median plots above, these show the difference between these cities and controls, without recentering the values at zero on the day the mandate was passed. Positive values show that the city is doing better than non-mandate cities. Since July, Lawton has improved relative to all no-mandate cities. And specifically, since the mandate passed on July 17 it has seen an strong improvement compared to nearby cities.
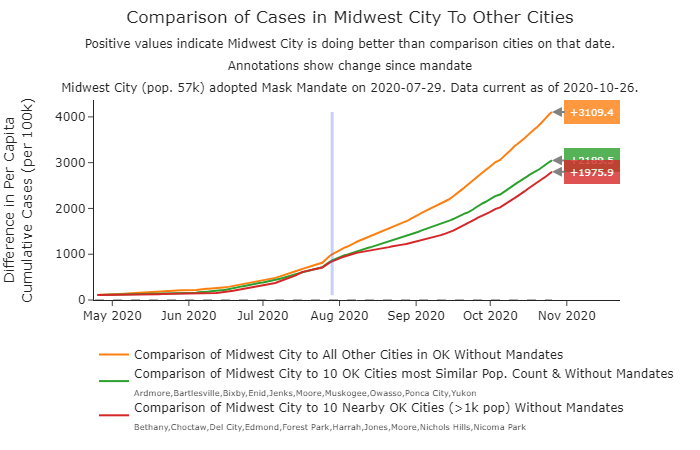
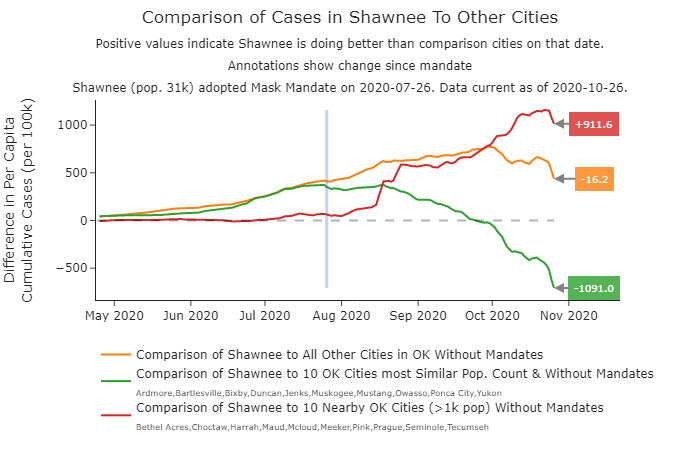
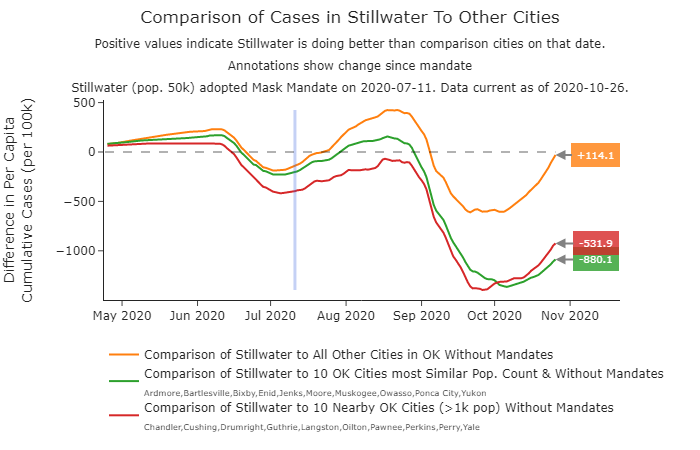
As of Aug 12, The Village has just a single confirmed case, which was reported on June 27.
Mixed Results
Both Norman and Oklahoma City are faring better than all non-mandate cities, but not compared to nearby non-mandate cities.
Outbreak With Mandate
Altus is currently experiencing a significant outbreak. It has grown from 65 reported cases on July 14 to 432 as of August 1. That is a 6.5x increase in reported cases in just over two weeks. With a population of around 19,000 people, this makes it one of the hardest hit in the state, and as of July 29 all of the beds in the Jackson County Memorial Hospital were in use. Altus passed the mask ordinance on July 15, so the outbreak started before the mandate. Based on state Active case numbers, it is possible the outbreak peaked on July 25, but it will take a few weeks to know for certain. Given the scale of the outbreak, Altus will always stand out in these comparisons.
Anadarko also began a spike in cases in the week before they passed the mandate.
Warr Acres. When the mandate passed July 22, Warr Acres had 55 reported cases. Those have been increasing steadily (as in most of Oklahoma), and then on July 30, Warr Acres had its largest single day spike, with 29 reported cases. Because of this spike
Doing Worse
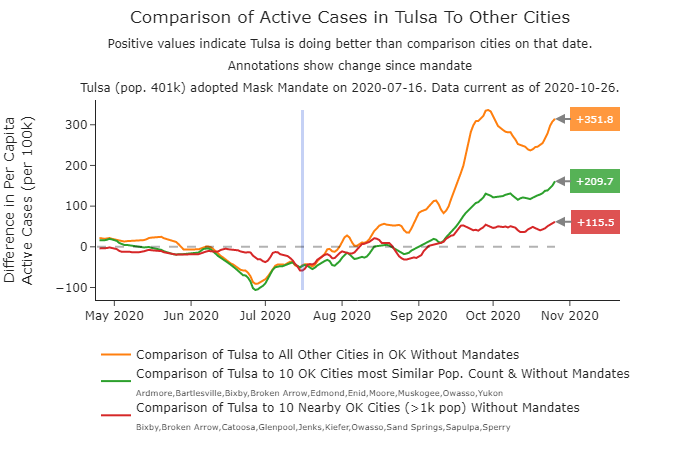
Tulsa is the lone mask mandate city doing measurably worse since their mandate. Although, the outbreak in Tulsa seemed to have started in June, and the relative curve in cases appears to have been bending since the mandate.
If we use Active Cases, Tulsa’s relative improvement since the mandate is more visible.
Hard To Know
Spencer has been doing worse than all non-masked cities for the most of the duration of the pandemic as well as doing worse than some nearby communities without mandates. Since the mandate has passed, they have improved slightly compared to all non-mandate cities, but are doing slightly worse compared to local communities. But given the small population, it would be best to wait for 6-8 weeks of data to be certain of any trends.
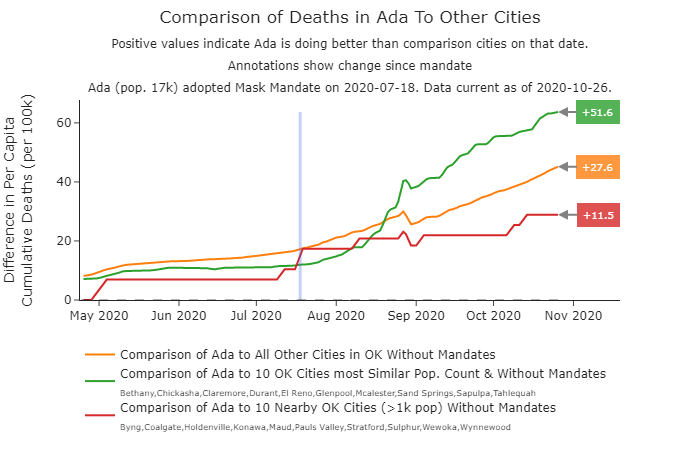
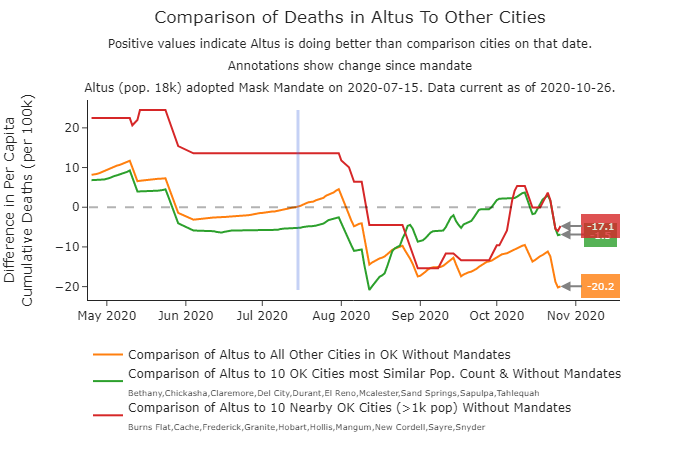
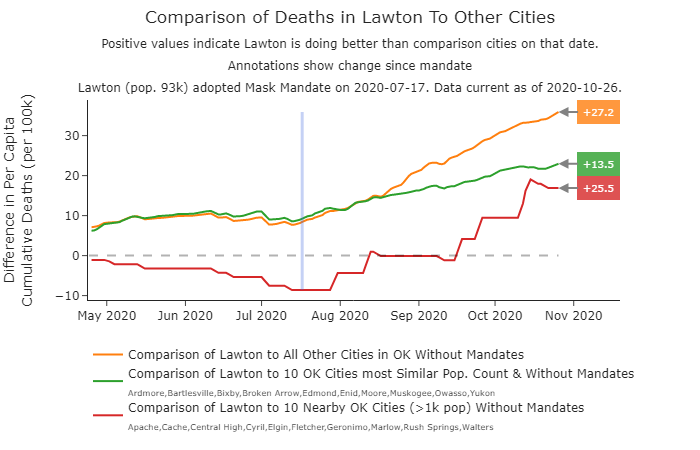
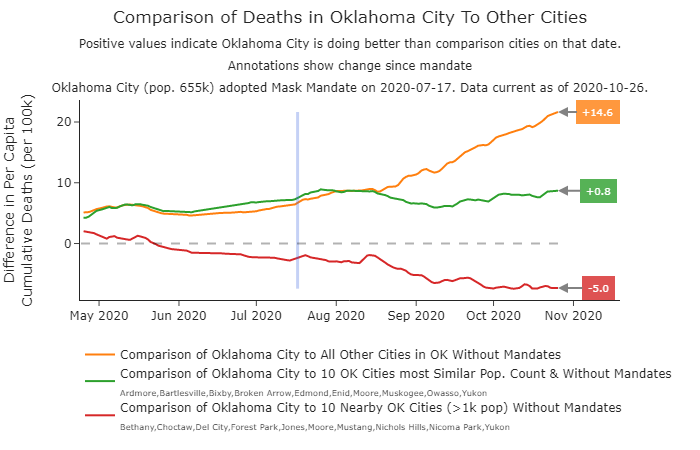
The Experiences of Individual Cities – Deaths
It is still too early to assess the impact of masks on mortality, given the lag involved. I would not pay much attention to this until at least 6 weeks after the mandates went into effect. But I will include the plots below and update them daily.


Caveats About the Data and Methods
Cases and Deaths are very blunt instruments to understand a pandemic. Ideally, we would also look at percentages of positive tests, number of total tests, and hospitalizations, but these are not released on the OK Department of State dashboard on a per-city basis, just on a statewide basis. Clearly these are being monitored however, because this article suggests the positive test rate has been declining in cities with mandates.
Cases are problematic for comparing cities because it is likely that the level of testing varies between communities. If City A has twice as many tests and half as many actual community infections as City B, they will end up reporting the same number of Cases. Because of differences in access to tests, wealth, and attitudes towards the pandemic, it is likely that testing is not done at the same intensity between every city in Oklahoma, but there is no way to check for it or control for that easily with the data at hand. This is why it would be helpful if the state reported total number of tests and/or percentage of positive cases. There were also issues with case reporting in late July that add noise around the time period we are most interested in, and might make it harder to see patterns.
There is also a data issue in how the state reports small and rural areas. They lump together problem data with data from small cities. They may also not be reporting some small cities (>100 pop) that do not yet have a case recorded.
My working assumption is that were we to better control for testing, mandate cities would look a little better. If we were to have a better handle on the data problems with rural and unlisted cities the non-mandate cities would look at little better. Perhaps someone with access to these data can provide insight.
Deaths are also somewhat complicated as a way to track the pandemic. We know that the elderly and those with preexisting conditions are the most vulnerable. Cities that experience outbreaks among vulnerable populations, such as nursing homes, may see elevated counts in deaths out of proportion to the overall level of community infection. But it is also the working theory that by reducing virus load, masks improve outcomes even in those that gen infected while using them. So over the long term, we should see cities with mask mandates have lower case mortality rates. We should expect these differences won’t be manifest until many weeks after the mask mandates have passed.
Also, even in cities without mask ordinances, there are community members wearing masks as well as people in cities with mask mandates who do not wear masks. Over the last few weeks, many national business chains have adopted rules that employees and customers must wear masks in the store. Ideally to measure the real value of masks we would be able quantify actual percentage of mask wearing between communities. But those data don’t exist to the best of my knowledge.
No doubt, public health officials in the state have access to more and better data than is being made available to the public. There are also more sophisticated ways to help understand the differences between cities based on more complicated comparisons that control for other measurable contributions to infection (like how mobile different populations are). The goal of this project was to use acceptable metrics that are as easily understood as possible.
I am not a public health worker. I welcome constructive critiques and comments.
Data Sources and Thanks
All of these data are ultimately based on what is reported by the Oklahoma State Department of Health on their Covid site. They release daily reports on cities, but do not archive them. A huge thank you to Reddit user idkwhatimbrewin, who had the foresight to capture these data and has made the effort to make these available through a Google Doc linked from/r/CoronavirusOklahoma/. They kindly let me make use of the numbers. My compilation of the City data, which combines idkwhatimbrewin’s archive with state data starting in July 25 can be downloaded as a CSV file.
Update Log
- Aug 12 IMPORTANT UPDATE: An epidemiologist contacted me to point out a critical error I had made. I have scrutinized so much of this (the code, the math, the definitions used by the OSDH), but I had neglected to notice that the source data table I used for population used metropolitan population instead of city population. Once that is included, the gap between mandate and non-mandate cities closes, and that changes the result numbers that I shared on this page and on social media on August 9. This has the biggest change on how we look at OKC and an even bigger impact on Tulsa. But as a whole, mandate cities are still faring better than non-mandate cities, and the gap has widened since the mandates started. I am also reassured that a professional has seen the same trend doing their analysis independently, and checked in with me because our numbers differently which lead to me finding my error. Needless to say, my apologies for this mistake.
- Aug 12 Change: I am now excluding cases the state puts in the category of ‘Other’ until I can determine the most accurate way to use them. This means the report above just compares all the cities the state has provided data on. According to the state’s definition, Other includes “Missing, Unknown, Small Cities, Towns or Zip Codes (<100 population)” and there are 859 such cases as of today (8/12). By combining cases from rural areas and those with bad data, it makes it really hard to know how to treat it for this analysis, and it would be far preferable for the state to dis-aggregate these. Before Aug 12, I assumed nearly all of the Others were rural residents, and assigned them all to non-mandate cities, and calculated their per capita population by process of elimination. I did this because at the time I noted that, there are just 3 cases reported as “Other.” Thus, I assumed the incidents of bad and missing data were extremely low. However, I noticed on Aug 12 that the Zip report shows 590 under Other. This is despite the fact that Oklahoma only has 20 zip codes with a population of 100 or fewer, with a total of 1280 people. This implies the opposite, and that the bad data accounts for most of counts in Other. If anyone has more insight on how the state uses the Other category in their city report, I would appreciate learning.
- Aug 9 Update: Text updated. Graph format changed to hopefully make these easier to understand. Previous plots of individual cities zeroed y axis at date of mask mandate which facilitated reading the changes after mandates, but made reading what was happening before the mandate counterintuitive. Also, an error was discovered that change comparisons between mandate and non-mandate cities slightly. Namely, OSDH classifies some cases under “Other***”. These cases and deaths were being included, but I had neglected to include their population. Correcting this added about 300k more people in non-mandate communities, and thus decreased per-capita values in those cities. After this change, mandate cities lost 10-15% of their advantage in cases and deaths. Plots after Aug 9 have this fixed.