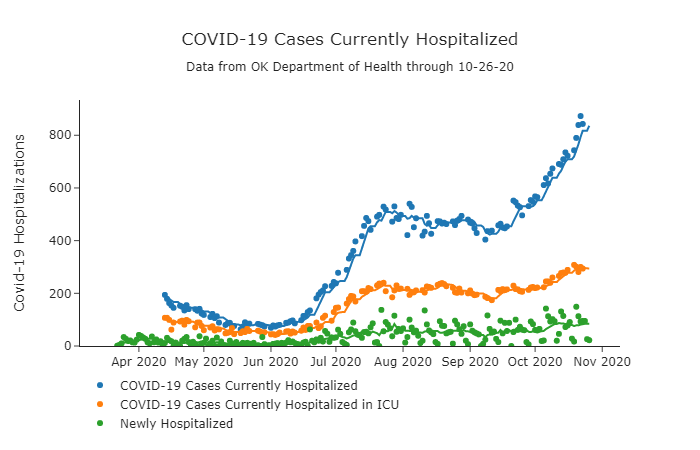
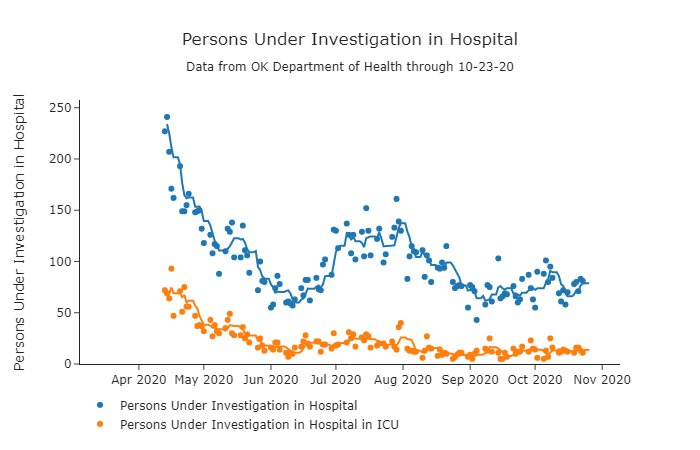
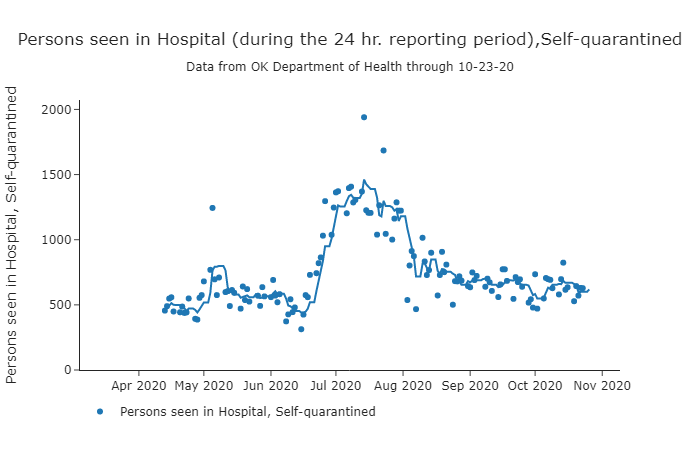
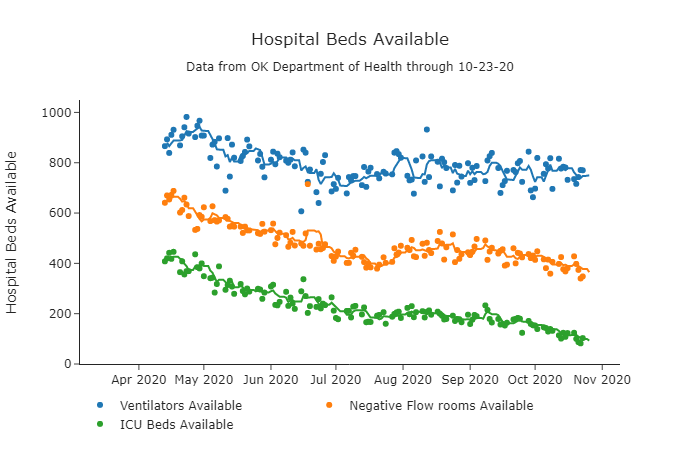
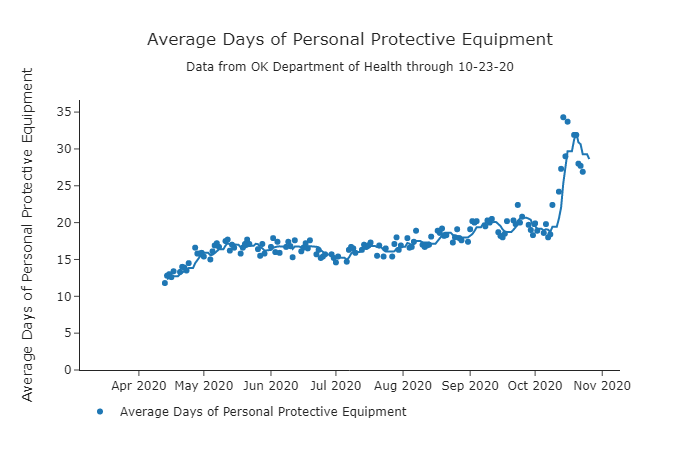
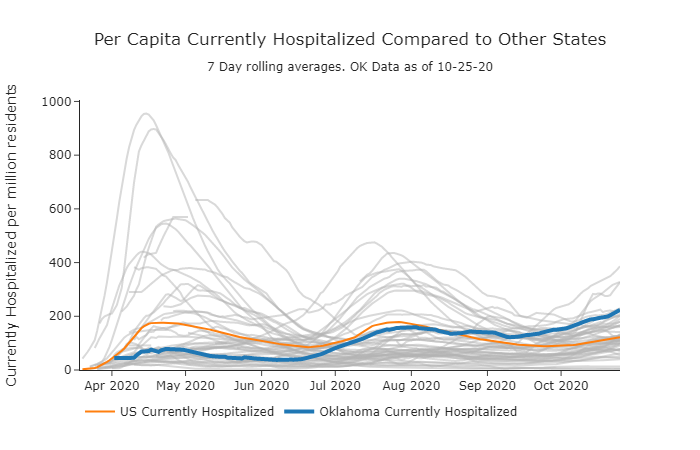
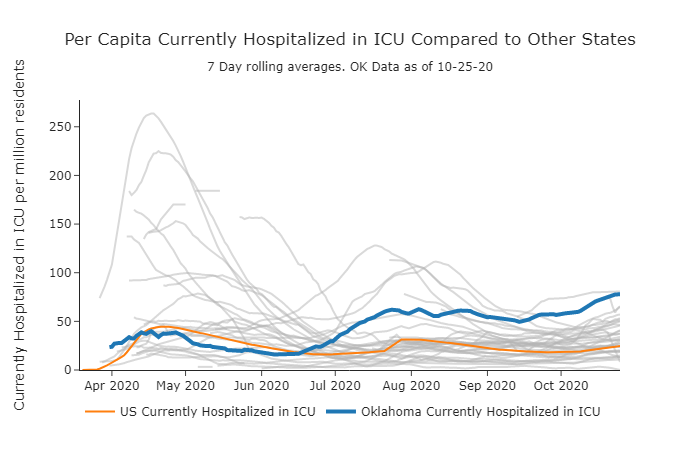
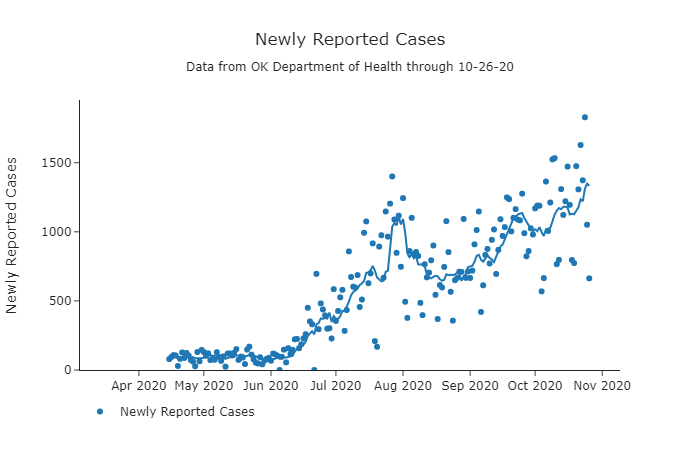
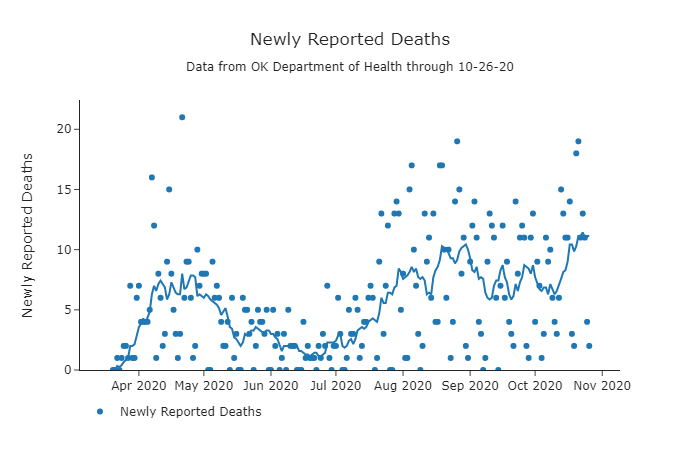
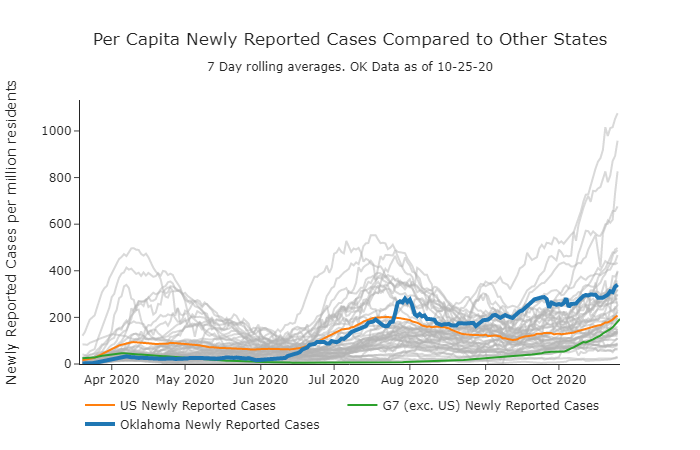
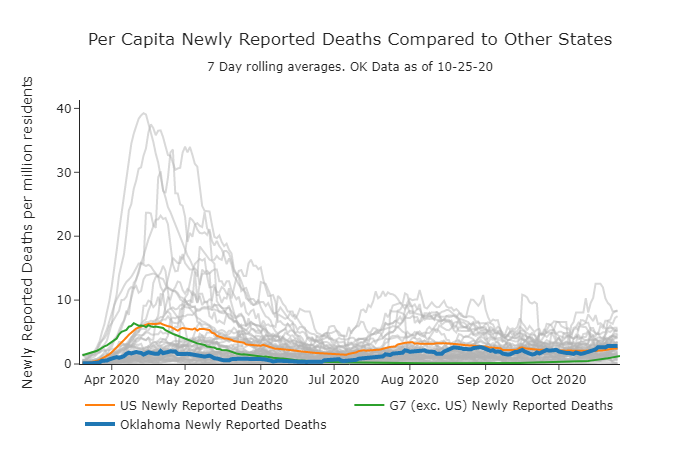
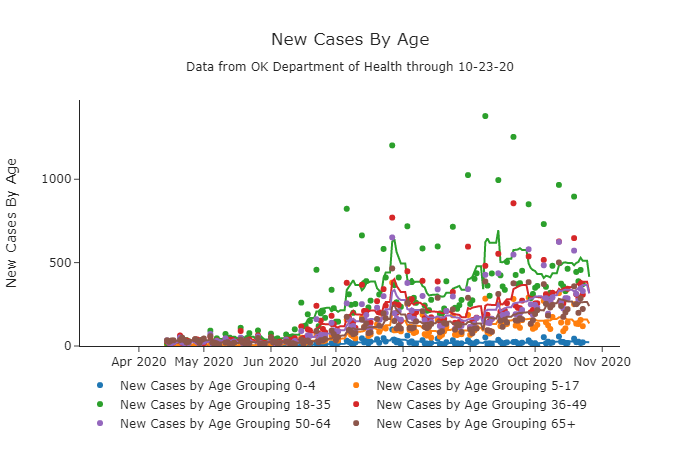
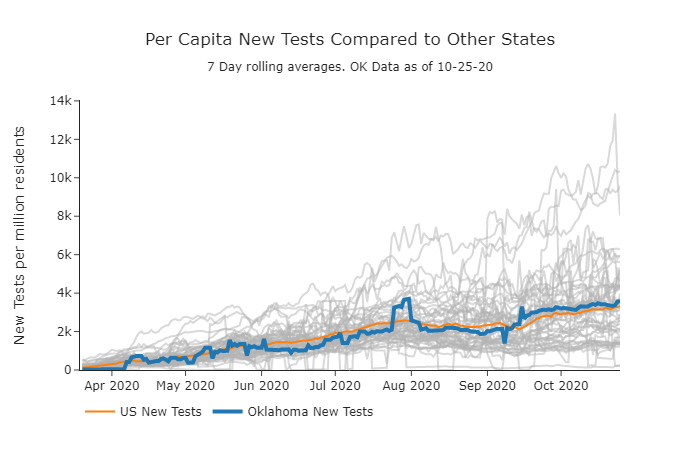
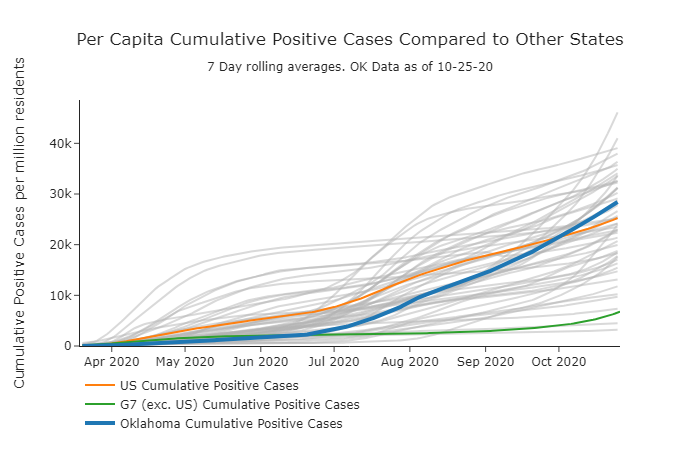
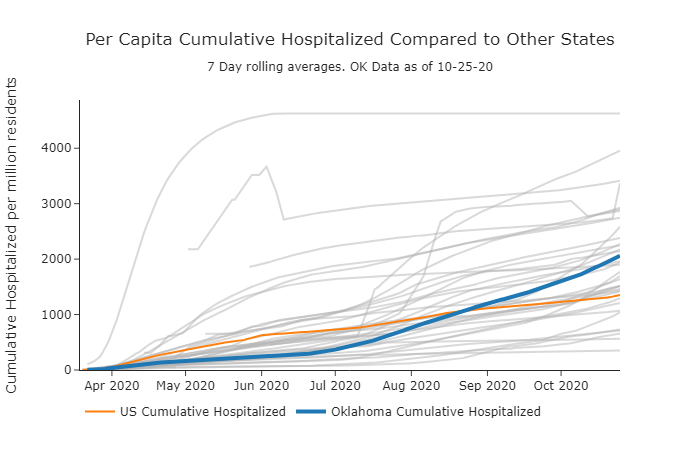
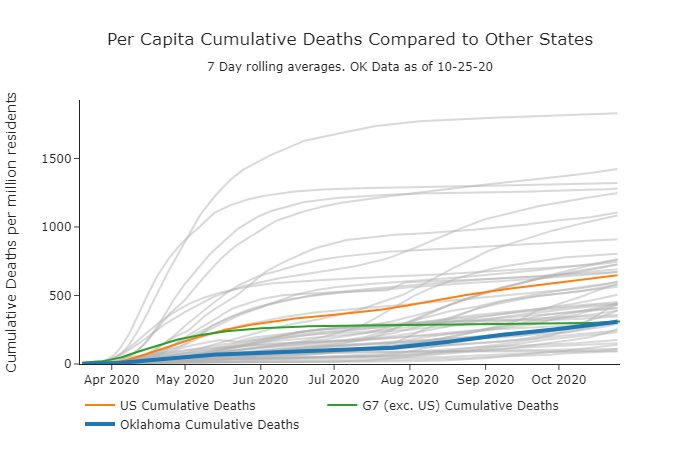
Click on the plots to open them in a page where you can inspect individual values.
Total Cases, Deaths, and Hospitalizations are updated midday sometime after the Oklahoma Department of Health releases their numbers. The other values are mostly found in the Executive Reports, which are not issued until the late afternoon or evening of weekdays.
The plots below are using data from the Oklahoma State Department of Health Covid resources. See the About page for further details.
Hospitalization Rate and Hospital Capacity
Hospitalization Per Capita
New Cases and Deaths
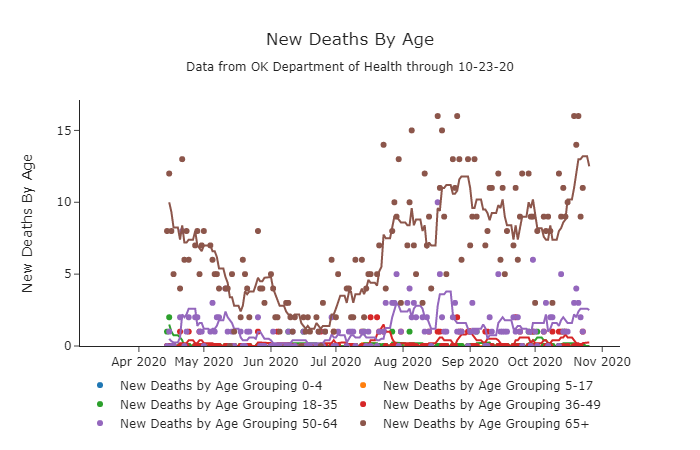
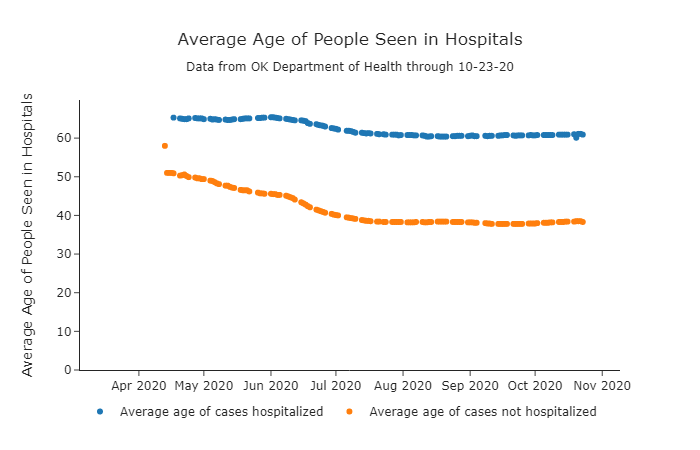
Ages of New Cases, Deaths, and Hospital Patients
Testing
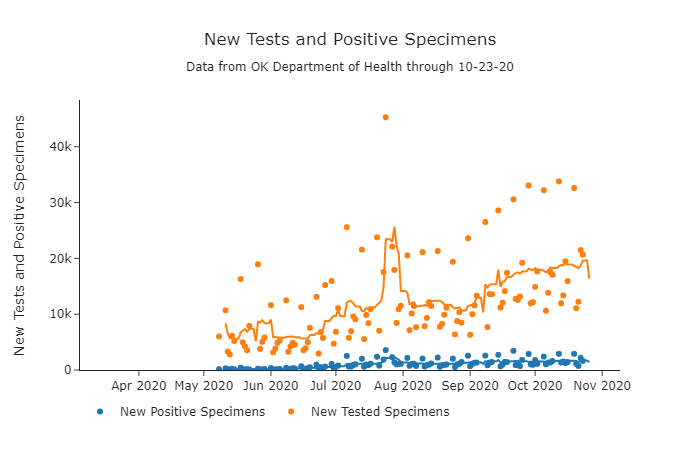
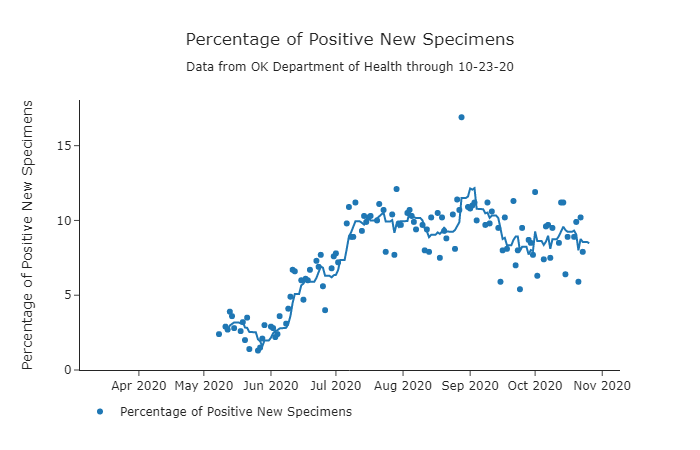
The Oklahoma Department of Health reports number of Covid-19 tests and the number of positive Covid-19 tests. They state that tests do not reflect unique individuals. Presumably some individuals have been tested multiple times and some tests repeated because of issues with false-positives and false-negatives. The reports present cumulative number of tests and positives at the time of the report. The plots below show the new counts since the last report, starting May 8. This sets aside the 89,859 tests and 4779 positives which were done prior to May 7, for which there is no information on when they were performed.
